HDD short stroking – is it worth it?

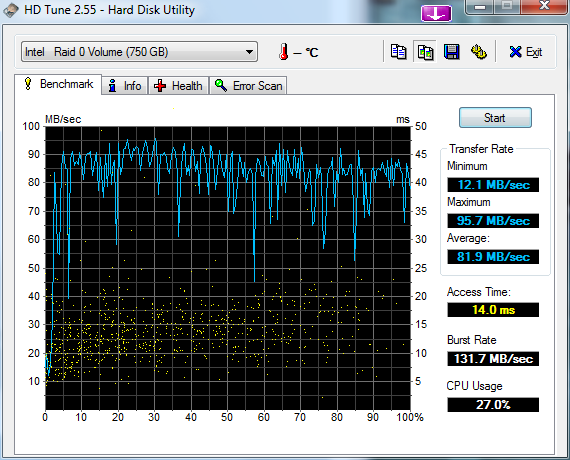
I’ve got some old 250Gb drives that are starting to show their age. I’ve currently got them setup in a 3x RAID 0 config which presents about 750Gb of space.

I’ve got everything on a single partition (meh, i’m lazy). I’ve done various speed tests in the current setup (with all space allocated), but i thought i’d re-image onto a short stroke partition.

I only use about 150Gb of space on my main machine (most of my data is on another box), so i’m going to try creating a 200Gb partition to test if this provides any kind of performance boost.

So reducing my raid 0 from 750Gb to 214Gb, and here are the results…

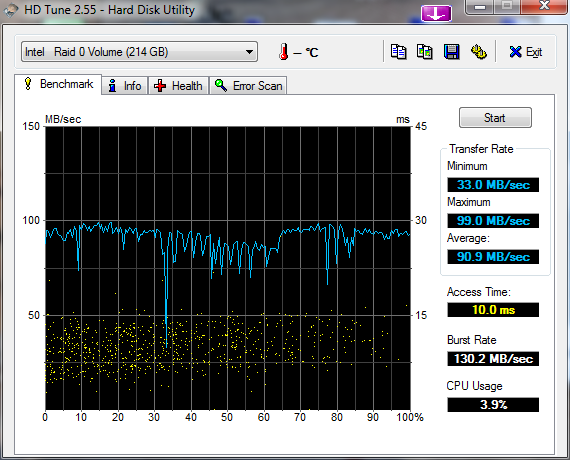
Before with all 750Gb presented…

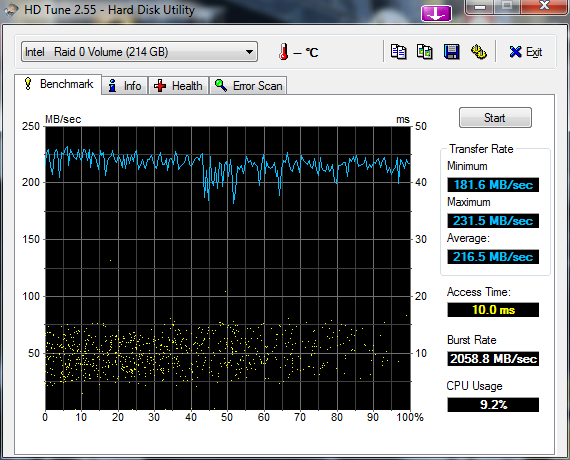
Same disks but short stroked to 214Gb….

Conclusion : Yip, seems like its worth it if you have the spare space. Average throughput is up by 10MB/s and seek has improved by almost a third loosing 4ms.

You will get even more of an improvement if you can use a smaller % of capacity per drive and / or more drives for your stripe.

Updated : 07/02/2010

btw – the above was without write-back cache enabled…. if i turned that on i got the following…
OpenSolaris – iSCSI

Want iSCSI in opensolaris?

Grab SUNWiscsitgt via package manager.

enable the server via svcadm;

svcadm enable iscsitgt

create your zfs iscsi pool;  (this command will limit iscsi drive to 500GB in size)

zfs create -V 500G tank/iscsi

set isci on via zfs command;

zfs set shareiscsi=on tank/iscsi

check that target is up and running;

iscsitadm list target -v

Done. Should be able to connect via ip from another machine. I have not covered CHAP or any client side configuration. Assumed isolated LAN.

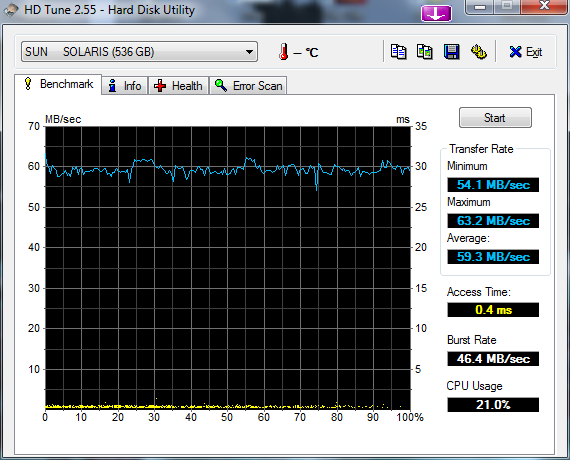
HDTune_Benchmark_SUN_____SOLARIS

Opensolaris – ZFS recovery after kernel panic

Recently i hit what i thought was a huge disaster with my ZFS array. Essentially i was unable to import my zpool without causing the kernel to panic and reboot. Still unsure of the exact reason, but it didn’t seem to be due to a hardware fault. (zpool import showed all disks as ONLINE)

When i tried to import with zpool import -f tank the machine would lockup and reboot (panic).

The kernel panic;  (key line)

> genunix: [ID 361072 kern.notice] zfs: freeing free segment (offset=3540185931776 size=22528)

Nothing i could do would fix it… tried both of these options in the system file with no success;

set zfs:zfs_recover=1
set aok=1

After a quick email from a Sun Engineer (kudos to Victor), the zdb command line that fixed it;

zdb -e -bcsvL <poolname>

zdb is a read only diagnostic tool, but seemed to read through the sectors that had the corrupt data and fix things??  (not sure how a read only tool does that) – the run took well over 15hrs.

Updated: 20/10/2009

Apparently if you have set zfs:zfs_recover=1 in your system file the zdb command will operate in a different manner fixing the issues it encounters.

Remember to run a zpool scrub <poolname> if you are lucky enough to get it back online.

This thread has some additional info…

http://opensolaris.org/jive/message.jspa?messageID=479553

Update 31/05/2012

This command has also helped me when i cant mount a pool in RW mode

zpool import -F -f -o readonly=on -R /mnt/temp zpool2

zfs compression and latency

Since im using ZFS as storage via NFS for my some of my vmware environments i need to ensure that latency on my disk is reduced where ever possible.

There is alot of talk about ZFS compression being “faster” than a non-compressed pool due to less physical data being pulled off the drives. This of course depends on the system powering ZFS, but i wanted to run some tests specifically on latency. Throughput is fine in some situations, but latency is a killer when it comes to lots of small reads and writes (in the case of hosting virtual machines)

I recently completed some basic tests focusing on the differences in latency when ZFS compression (lzjb) is enabled or disabled. IOMeter was my tool of choice and i hit my ZFS box via a mapped drive.

I’m not concerned with the actual figures, but the difference between the figures

I have run the test multiple times (to eliminate caching as a factor) and can validate that compression (on my system anyhow) increases latency

Basic Results from a “All in one” test suite… (similar results across all my tests)

ZFS uncompressed:

IOps : 2376.68
Read MBps : 15.14
Write MBps : 15.36
Average Response Time : 0.42
Average Read Response Time : 0.42
Average Write Response Time : 0.43
Average Transaction Time : 0.42

ZFS compressed: (lzjb)

IOps : 1901.82
Read MBps : 12.09
Write MBps : 12.28
Average Response Time : 0.53
Average Read Response Time : 0.44
Average Write Response Time : 0.61
Average Transaction Time : 0.53

As you can see from the results, the AWRT especially is much higher due to compression. I wouldn’t recommend using zfs compression where latency is a large factor (virtual machines)

Note: Under all the tests performed the CPU (dual core) on the zfs box was never 100% – eliminating that as a bottleneck.