Flashing si3114 to sata only bios

This is the perfect controller for adding additional sata drives into opensolaris (well in terms of price, the bandwidth of the PCI slot is the only negative part). The si3114 comes with the default bios that supports various raid configs, but this requires additional drivers to be loaded.

Essentially the “raid” on the card is called fakeraid as it does not actually process any data itself, but hooks into the cpu via a driver and lets your cpu do all the work.

Instead we will flash the bios to be a sata only controller (no raid). If we are using ZFS its better to just present the disks and let the OS take care of the work.

You will need these tools;

bio-003114-x10_5403 – the various bios’s for the si3114 card

siflashtool – the flashing tool

Note : you must plug in a hard drive into the card or else the flash will not work.

From the zip above you want to grab this file for the bios flash “b5403.bin” the other is for raid and can be ignored.

Now you’ll need to grab your trusty bootable flash drive / usb stick. If you dont have one check out HP’s tool for creating one (else you could use a floppy boot disk if you still have one). Copy the files onto it, and boot it up.

The instructions say you can flash in windows, but i never had any luck with that – instead found booting to dos a much more reliable method. This is the commandline to run it;

SiFlashTool /File:b5403.bin

Done.
Opensolaris – where has my memory gone?

Use this command in 2008.11 to get details on where your memory is currently being used…

echo ::memstat | pfexec mdb -k

Page Summary                Pages                MB  %Tot
————     —————-  —————-  —-
Kernel                     263992              1031   34%
ZFS File Data               91917               359   12%
Anon                       376867              1472   48%
Exec and libs               11484                44    1%
Page cache                   3387                13    0%
Free (cachelist)             9766                38    1%
Free (freelist)             24807                96    3%

Total                      782220              3055
Physical                   782219              3055

Note: ZFS should eat up the remainder of your ram after a bit of use.

“ZFS File Data” is the one to look at – if it is low then most of your ram may be eaten up in other areas of the system.

From the output above you can see that i have 3GB installed. I have a few VirtualBox VM’s running on my server which show up as “Anon”, they are consuming almost half of my ram.

zfs – java management gui

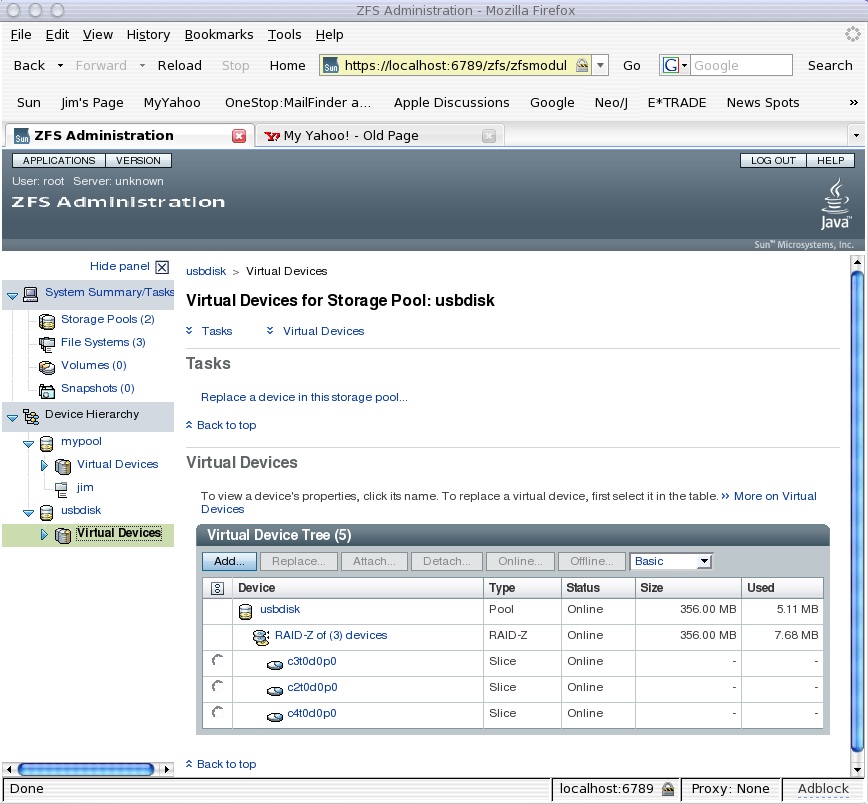
It hasn’t made it into opensolaris yet. But from what i’ve heard it should be making an appearance over from the solaris 10 OS soon. Here is a screenshot of what it looks like…

zfsscreenshot

Should make managing zfs a bit easier – though its already quite easy.  Perhaps if you have quite alot of zpools / zfs file systems it will look prettier.   ;)

Troubleshooting – Time Slider (zfs snapshots)

1. snapshot complains about no access to cron

This problem i came across was after i was playing with crontab. It looks like the zfs snapshot service uses an account called “zfssnap” and if it doesnt have access to cron then it will have issues creating / checking snapshots. Check the file /etc/cron.d/cron.allow and ensure that “zfssnap” is in there. The issues i had looked like this in the log…   (check the logs via the log file viewer)

Checking for non-recursive missed // snapshots  rpool

Checking for recursive missed // snapshots protected rpool/backup rpool/export rpool/ROOT unprotected

crontab: you are not authorized to use cron.  Sorry.

crontab: you are not authorized to use cron.  Sorry.

Error: Unable to add cron job!

Moving service to maintenance mode.

The actual crontab lives in the /var/spool/cron/crontab/zfssnap file. (don’t edit this manually)

Restart the services by clearing the maintenance status then if required enable or restart like so…

svcadm clear auto-snapshot:frequent

svcadm enable auto-snapshot:frequent

Check that all zfs snapshot services are running as expected….

svcs -a | grep snapshot

online         22:26:12 svc:/system/filesystem/zfs/auto-snapshot:weekly

online          9:06:36 svc:/system/filesystem/zfs/auto-snapshot:monthly

online          9:11:23 svc:/system/filesystem/zfs/auto-snapshot:daily

online          9:12:00 svc:/system/filesystem/zfs/auto-snapshot:hourly

online          9:23:57 svc:/system/filesystem/zfs/auto-snapshot:frequent

2. snapshot fails with dataset busy error

Seen something similar to this in the logs? …

Checking for recursive missed // snapshots protected rpool/backup rpool/export rpool/ROOT unprotected

Last snapshot for svc:/system/filesystem/zfs/auto-snapshot:frequent taken on Sun Mar 15 22:26 2009

which was greater than the 15 minutes schedule. Taking snapshot now.

cannot create snapshot 'rpool/ROOT/opensolaris@zfs-auto-snap:frequent-2009-03-16-09:06': dataset is busy

no snapshots were created

Error: Unable to take recursive snapshots of rpool/ROOT@zfs-auto-snap:frequent-2009-03-16-09:06.

Moving service svc:/system/filesystem/zfs/auto-snapshot:frequent to maintenance mode.

Here is an bit from this site – “This problem is being caused by the old (IE: read non-active) boot environments not being mounted and it is trying to snapshot them. You can’t ‘svcadm clear’ or ‘svcadm enable’ them because they will still fail.”

Apparently a bug with the zfs snapshots similar to /root/opensolaris type pools — anyhow to fix i’ve just used a custom setup in time slider. Clear all the services set to “maintenance” then launch time-slider-setup and configure to exclude the problem pools.

Update : As per Johns comments below you can disable the snapshots on the offending zfs system using the following command…

zfs set com.sun:auto-snapshot=false rpool/ROOT

As above to clear “maintenance” status on the effected services run the following command…

svcadm clear auto-snapshot:hourly

svcadm clear auto-snapshot:frequent

Now run this to ensure all the SMF services are running without issue…

svcs -x

If all is well you will get no output.

zfs – checking your zpool throughput

This is quite a good diagnostic for checking your disk throughput. Try copying data to and from your zpool while your running this command on the host…

zpool iostat -v unprotected 2

capacity     operations    bandwidth
pool         used  avail   read  write   read  write
----------  -----  -----  -----  -----  -----  -----
unprotected  1.39T   668G     18      7  1.35M   161K
c7d0       696G   403M      1      2  55.1K  21.3K
c9d0       584G   112G      8      2   631K  69.3K
c7d1       141G   555G      8      2   697K  70.0K
----------  -----  -----  -----  -----  -----  -----

The above command will keep displaying the above output every 2 seconds (average during that time). I’ve used it a few times to ensure that all disks are being used (in write operations) where needed. Of course read op’s may not be typically across all disks as it will depend where the data is…

As you can see in the output from my “unprotected” zpool, my disk “c7d0” is near full so less write operations will be on this disk. In my scenario most of my reads also come from this disk, this was due me copying most of the data into this zpool when there was only this single disk.

I’ve heard rumor of a zfs feature in future that will re-balance the data across all the disks (unsure if its live or on a set schedule)

Another way to show some disk throughput figures is to run the iostat command like so…

iostat -exn 10

extended device statistics
device    r/s    w/s   kr/s   kw/s wait actv  svc_t  %w  %b
cmdk17    1.0    0.0   71.5    0.0  0.0  0.0   10.9   0   1
cmdk18    0.0    0.0    0.0    0.0  0.0  0.0    0.0   0   0
cmdk19    0.0    0.0    0.0    0.0  0.0  0.0    0.0   0   0
cmdk20    0.8    0.0   33.5    0.0  0.0  0.0   13.5   0   1
cmdk21    0.4    0.0    0.5    0.0  0.0  0.0   15.5   0   1
cmdk22    0.8    0.0   66.3    0.0  0.0  0.0    9.0   0   1
cmdk23    0.0    0.0    0.0    0.0  0.0  0.0    0.0   0   0

cmdk24    0.0    0.0    0.0    0.0  0.0  0.0    0.0   0   0

extended device statistics       —- errors —

                     extended device statistics       ---- errors --- 


r/s    w/s   kr/s   kw/s wait actv wsvc_t asvc_t  %w  %b s/w h/w trn tot device
0.0    0.0    0.0    0.0  0.0  0.0    0.0    0.0   0   0   0   0   0   0 c11d1
0.0    7.7    0.0   25.8  0.0  0.0    2.3    4.9   0   3   0   0   0   0 c8d0
0.0   17.6    0.0  238.0  0.0  0.0    0.0    0.3   0   0   0   0   0   0 c9d0
0.0    1.0    0.0    0.8  0.0  0.0    0.0    0.3   0   0   0   0   0   0 c7t0d0
0.0    1.0    0.0    0.8  0.0  0.0    0.0    0.2   0   0   0   0   0   0 c7t2d0
0.0    1.0    0.0    0.8  0.0  0.0    0.0    0.3   0   0   0   0   0   0 c7t3d0
0.7   21.1   29.9  315.0  0.0  0.0    0.0    1.1   0   1   0   0   0   0 c7t4d0
0.7   20.9   29.8  314.9  0.0  0.0    0.0    1.7   0   2   0   0   0   0 c7t5d0
0.8   21.0   34.1  315.0  0.0  0.0    0.0    1.2   0   1   0   0   0   0 c7t6d0
0.5   20.8   21.3  314.8  0.0  0.0    0.0    1.1   0   1   0   0   0   0 c7t7d0

This should show you all your disks and update on a 5 second interval. Copying data back and forth to your drives will show various stats.